Not all state legislatures are created equal. Some have hundreds of legislators, while others only have a handful. The number of people each legislator actually represents, the per capita amount each state has, varies across the country.
So where does Massachusetts land?
Massachusetts Baseline
The Massachusetts General Court has 200 total legislators, 40 Senators and 160 Representatives. According to the United States Census Bureau, the state population of Massachusetts is 7,154,084 residents. This equates to around 36,000 residents for every legislator (7,200,000 / 200). Each Senator represents about 180,000 residents (7,200,000 / 40) and each Representative represents about 45,000 residents (7,200,000 / 160).
How does that compare to the rest of the country?
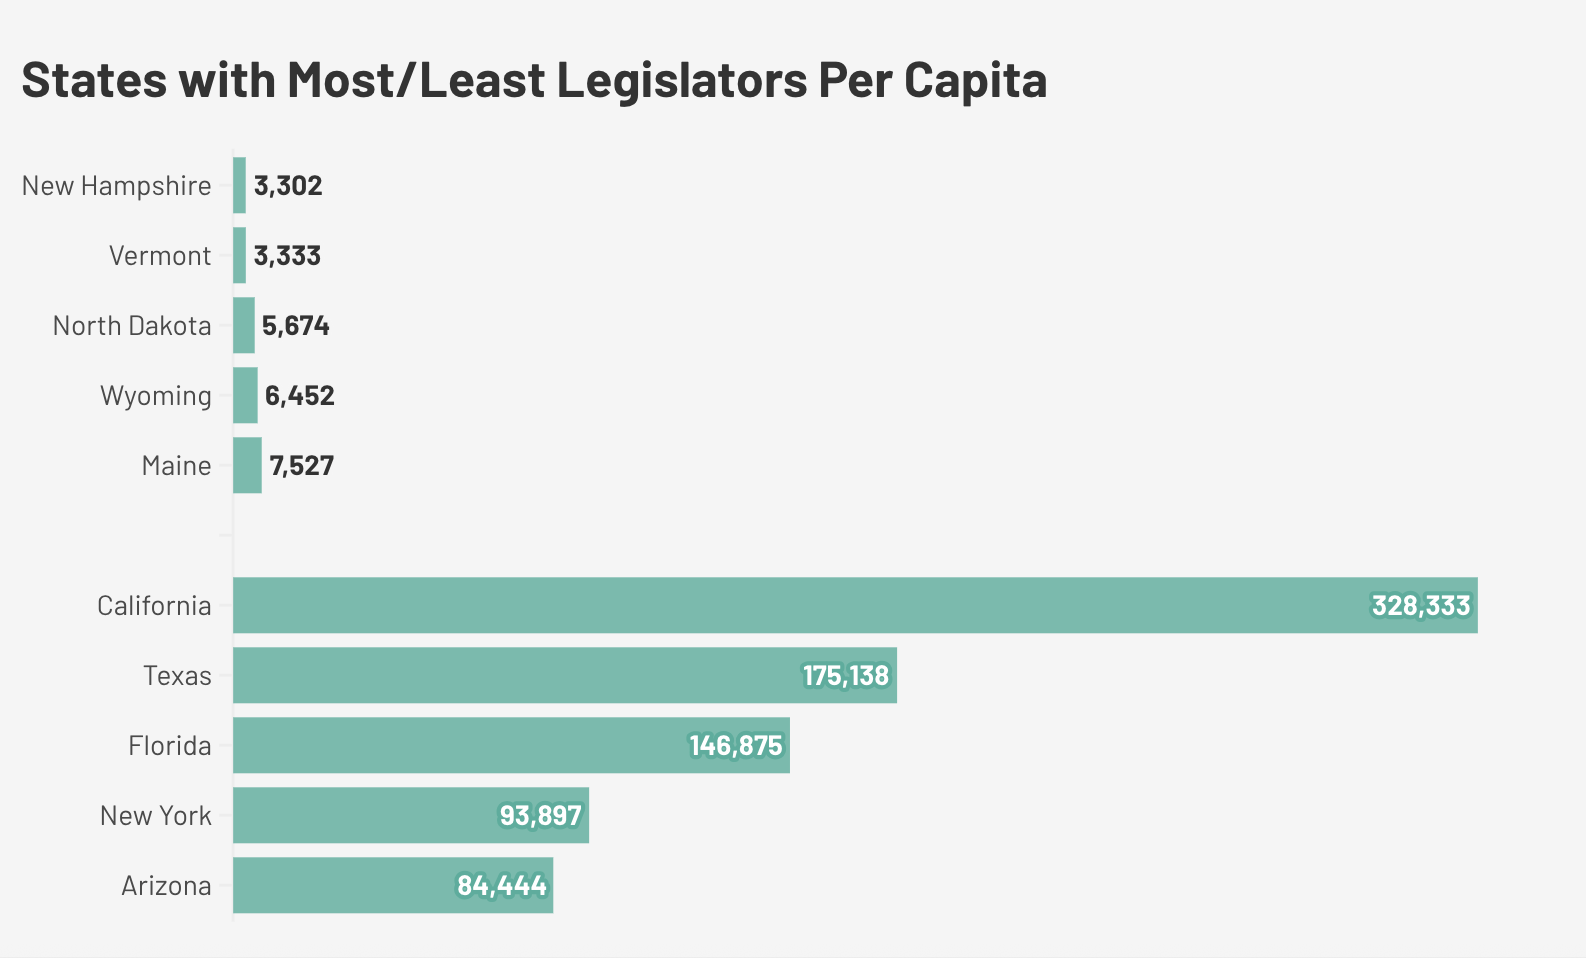
State | Population (closest hun thousand) | Total Legislators | Senate | House | Total per capita | Senators per capita | House Members per Capita |
New Hampshire | 1,400,000 | 424 | 24 | 400 | 3,302 | 58,333 | 3,500 |
Vermont | 600,000 | 180 | 30 | 150 | 3,333 | 20,000 | 4,000 |
North Dakota | 800,000 | 141 | 47 | 94 | 5,674 | 17,021 | 8,511 |
Wyoming | 600,000 | 93 | 31 | 62 | 6,452 | 19,355 | 9,677 |
Montana | 1,100,000 | 150 | 50 | 100 | 7,333 | 22,000 | 11,000 |
Maine | 1,400,000 | 186 | 35 | 151 | 7,527 | 40,000 | 9,272 |
South Dakota | 900,000 | 105 | 35 | 70 | 8,571 | 25,714 | 12,857 |
Rhode Island | 1,100,000 | 113 | 38 | 75 | 9,735 | 28,947 | 14,667 |
Alaska | 700,000 | 60 | 20 | 40 | 11,667 | 35,000 | 17,500 |
West Virginia | 1,800,000 | 134 | 34 | 100 | 13,433 | 52,941 | 18,000 |
Mississippi | 3,000,000 | 174 | 52 | 122 | 17,241 | 57,692 | 24,590 |
Delaware | 1,100,000 | 62 | 21 | 41 | 17,742 | 52,381 | 26,829 |
Kansas | 3,000,000 | 165 | 40 | 125 | 18,182 | 75,000 | 24,000 |
Hawaii | 1,400,000 | 76 | 25 | 51 | 18,421 | 56,000 | 27,451 |
New Mexico | 2,100,000 | 112 | 42 | 70 | 18,750 | 50,000 | 30,000 |
Idaho | 2,000,000 | 105 | 35 | 70 | 19,048 | 57,143 | 28,571 |
Connecticut | 3,700,000 | 187 | 36 | 151 | 19,786 | 102,778 | 24,503 |
Iowa | 3,200,000 | 150 | 50 | 100 | 21,333 | 64,000 | 32,000 |
Arkansas | 3,100,000 | 135 | 35 | 100 | 22,963 | 88,571 | 31,000 |
Oklahoma | 4,100,000 | 149 | 48 | 101 | 27,517 | 85,417 | 40,594 |
Minnesota | 5,800,000 | 201 | 67 | 134 | 28,856 | 86,567 | 43,284 |
Louisiana | 4,600,000 | 144 | 39 | 105 | 31,944 | 117,949 | 43,810 |
Missouri | 6,300,000 | 197 | 34 | 163 | 31,980 | 185,294 | 38,650 |
South Carolina | 5,600,000 | 170 | 46 | 124 | 32,941 | 121,739 | 45,161 |
Kentucky | 4,600,000 | 138 | 38 | 100 | 33,333 | 121,053 | 46,000 |
Maryland | 6,300,000 | 188 | 47 | 141 | 33,511 | 134,043 | 44,681 |
Utah | 3,500,000 | 104 | 29 | 75 | 33,654 | 120,690 | 46,667 |
Massachusetts | 7,200,000 | 200 | 40 | 160 | 36,000 | 180,000 | 45,000 |
Alabama | 5,200,000 | 140 | 35 | 105 | 37,142 | 148,571 | 49,523 |
Nebraska | 2,000,000 | 49 | 49 | n/a | 40,816 | 40,816 | n/a |
Wisconsin | 6,000,000 | 132 | 33 | 99 | 45,455 | 181,818 | 60,606 |
Indiana | 7,000,000 | 150 | 50 | 100 | 46,667 | 140,000 | 70,000 |
Oregon | 4,300,000 | 90 | 30 | 60 | 47,778 | 143,333 | 71,667 |
Georgia | 11,300,000 | 236 | 56 | 180 | 47,881 | 201,786 | 62,778 |
Pennsylvania | 13,000,000 | 253 | 50 | 203 | 51,383 | 260,000 | 64,039 |
Nevada | 3,300,000 | 63 | 21 | 42 | 52,381 | 157,143 | 78,571 |
Washington | 8,000,000 | 147 | 49 | 98 | 54,422 | 163,265 | 81,633 |
Tennessee | 7,300,000 | 132 | 33 | 99 | 55,303 | 221,212 | 73,737 |
Colorado | 6,000,000 | 100 | 35 | 65 | 60,000 | 171,429 | 92,308 |
Virginia | 8,900,000 | 140 | 40 | 100 | 63,571 | 222,500 | 89,000 |
North Carolina | 11,200,000 | 170 | 50 | 120 | 65,882 | 224,000 | 93,333 |
Michigan | 10,100,000 | 148 | 38 | 110 | 68,243 | 265,789 | 91,818 |
Illinois | 12,700,000 | 177 | 59 | 118 | 71,751 | 215,254 | 107,627 |
New Jersey | 9,500,000 | 120 | 40 | 80 | 79,167 | 237,500 | 118,750 |
Arizona | 7,600,000 | 90 | 30 | 60 | 84,444 | 253,333 | 126,667 |
Ohio | 11,900,000 | 132 | 33 | 99 | 90,152 | 360,606 | 120,202 |
New York | 20,000,000 | 213 | 63 | 150 | 93,897 | 317,460 | 133,333 |
Florida | 23,500,000 | 160 | 40 | 120 | 146,875 | 587,500 | 195,833 |
Texas | 31,700,000 | 181 | 31 | 150 | 175,138 | 1,022,581 | 211,333 |
California | 39,400,000 | 120 | 40 | 80 | 328,333 | 985,000 | 492,500 |
The range of the number of legislators per capacity is vast. In New Hampshire, there is one legislator for every 3,302 residents. Your legislator may live down the street from you! Whereas, on the other end of the spectrum, there is one legislator for every 328,333 residents in California. Massachusetts stands around the middle at 36,000 residents per total legislators. More legislators means that the state government is more accessible and closer to each resident making democracy far more personal. On the other hand, it also means more cost and harder to get things done.
To find out how exactly this legislation is working for you in Massachusetts, book a demo with our team and learn more about MassTrac.